
Ping comes back clean and the service still refuses you, so the question moves from the host to the path between you and it. The traceroute command answers that question by making every router on the way report back.
Each probe it sends leaves with a small time to live value, and the first router that runs that value down replies with an error naming itself. I raise that value by one for the next probe, and the following router answers instead.
What traceroute is measuring
traceroute maps one path to one destination at one moment, and it does that by leaning on a field every IP packet already carries.
Time to live exists so a packet with a broken destination never circles forever. traceroute turns that safety limit into a measuring stick.
| Probe round | Time to live | What the router does | What the trace prints |
|---|---|---|---|
| First | 1 | Drops the packet and returns a time-exceeded message | The first router’s address and its three reply times |
| Second | 2 | The same, one router further along | The second router, same shape |
| Final | Enough to arrive | The destination itself answers | The last line, and the trace stops |
Every step sends three probes, and the run gives up at 30 hops. That is why a single line carries three times and why the command finishes on its own.
I traced a public resolver from a cloud host and the first hop came back as the provider’s own gateway, with a time under a millisecond. Reads further down the list describe somebody else’s network, which is where an internet problem lives.
Install traceroute on your distribution
Debian, Ubuntu, Fedora, Arch and openSUSE all package traceroute under the same name, and none of them install it by default. Find your family and run one line.
sudo apt install traceroute        # Debian, Ubuntu, Linux Mint
sudo dnf install traceroute        # Fedora, RHEL 9 and later
sudo pacman -S traceroute          # Arch, Manjaro
sudo zypper install traceroute     # openSUSE
When the install line fails, the error from apt names the missing package without telling you whether the name is wrong or the package lists are stale.
I installed the Ubuntu package and it landed as version 2.1.5, the modern build that prints the annotations decoded further down. Older tutorials describe the inetutils build, which answers differently and takes a different set of flags.
Check the version before you compare your output with anyone else’s, because the flags moved between those two packages.
Read a trace, column by column
A trace is short enough to read in full once you recognise the four things sitting on each line.
| Part of the line | Looks like | What it tells you |
|---|---|---|
| Hop number | 3 | How many routers the probe has crossed to reach this one |
| Address | 162.158.226.46 | The router that answered, with a name when reverse DNS resolves it |
| Round-trip time | 1.841 ms | One probe out and back, measured on the reply |
| Asterisk | * | That single probe drew no answer inside the wait window |
The header line states the limits
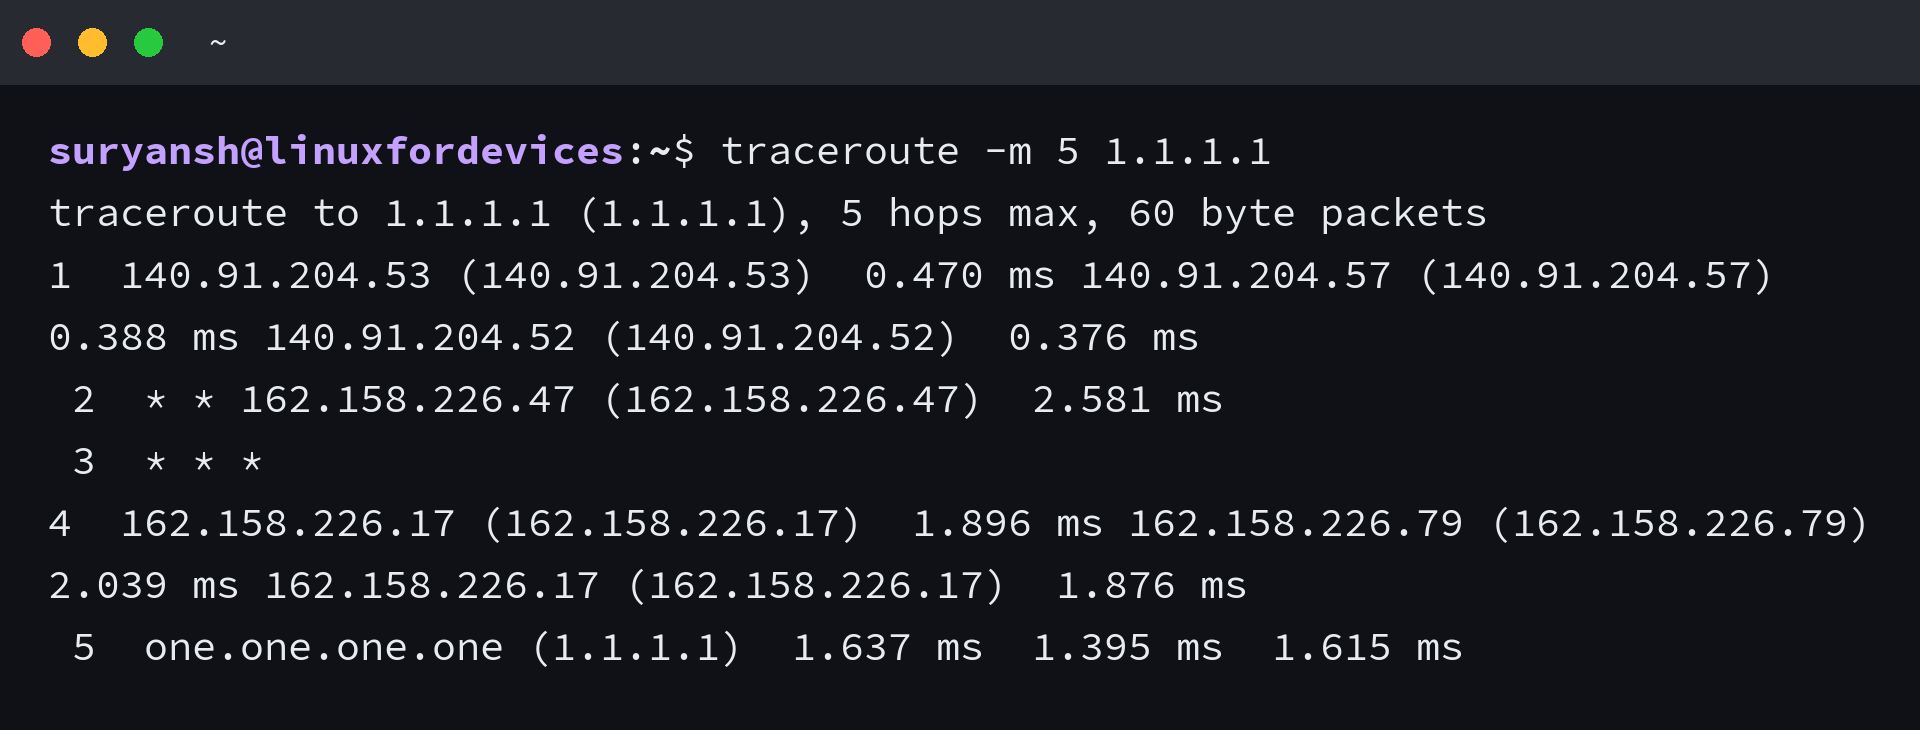
The first line repeats your destination, the hop ceiling and the probe size, which is the fastest way to see whether a flag you passed took effect. A longer packet changes that third value, so the header confirms a flag rather than leaving you to infer it from the hops below.
Why one line carries three times
Each time belongs to a separate probe, so a line reading 1.637 ms, 1.395 ms and 1.615 ms is a path that behaved the same way three times. I treat that steady shape as the baseline for the rest of the trace.
When the three values spread wide, the router is queueing and the path is under load. A single asterisk is routine on a live internet path, and the next probe usually answers it.
Routers deprioritise the error messages they generate, so the reply you time is often written after the traffic you care about has already passed through. That is why a middle hop can report a worse time than the last one.
Reading for a fault is a comparison rather than an absolute. A hop that suddenly jumps while the ones before it stayed flat marks where a delay starts, and every hop after it inherits that delay.
Pick the probe method that gets through
The default probe is a UDP datagram to an unlikely high port, and that is the packet a firewall is likeliest to drop without a word. The build on current distributions can send two other shapes when it holds the privilege to do so.
UDP probes, the default
Nothing stops a UDP probe on the path, and nothing obliges a router to answer one either. When the middle of a trace turns into asterisks, the probes are reaching routers that decline to reply to that kind of packet.
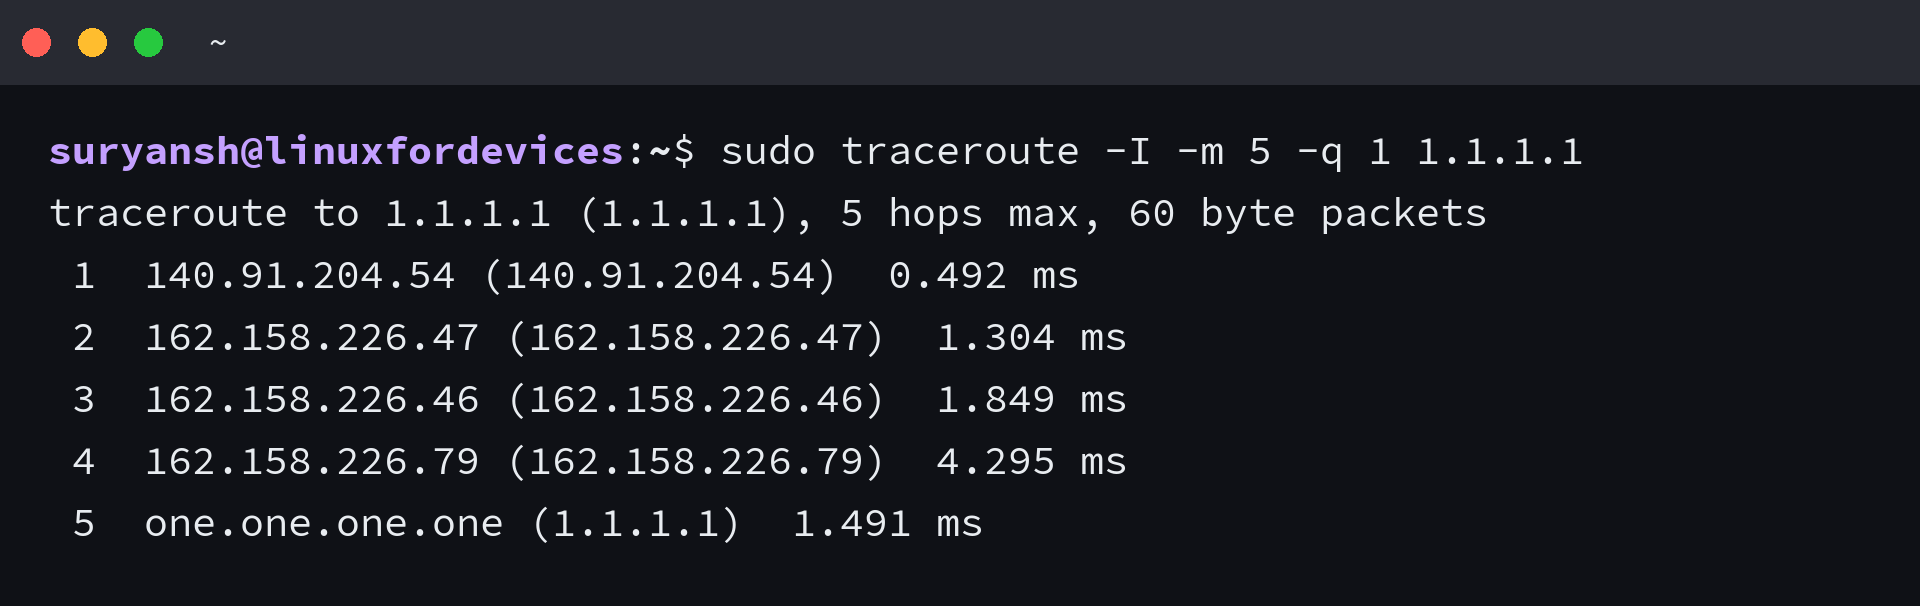
ICMP echo probes with -I
The -I flag sends echo requests instead, the same packet ping uses. Routers treat an echo request as ordinary traffic, so a hop that stayed silent under UDP often answers.
TCP SYN probes with -T
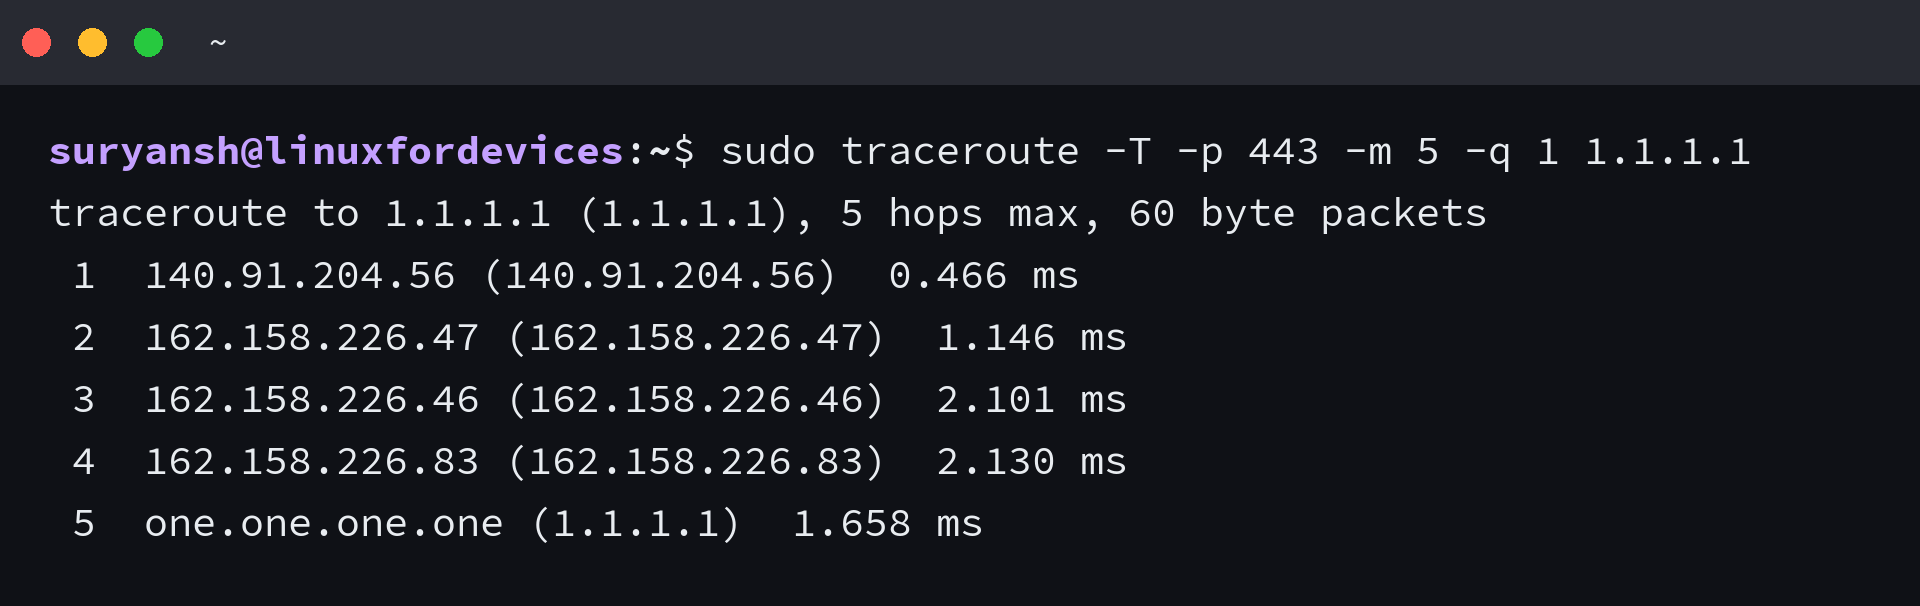
The -T flag opens a half-formed TCP connection to a port you name, which is the packet a firewall on a web path is built to let through. Point it at the port the service listens on, because a closed port answers differently.
Reaching the last hop over TCP 443 is the closest a trace gets to reproducing the connection you cannot make.
When neither method answers, the path is filtering more than one protocol and more probing will not change that. That is the ceiling of what a probe from your side can learn, so the next useful step is a capture near the server or the provider’s own looking glass.
Why the last two methods want root
Both build socket types the kernel reserves, so a normal user gets an error instead of a trace. Running commands through sudo covers the rest of the session once the install is in place.
I reproduced that refusal on a stock Ubuntu 24.04, where the ICMP form stops before sending anything and blames privileges rather than the network.

The setting behind it is net.ipv4.ping_group_range, which I checked on the same machine and found empty. An administrator can widen that range to a group and the ICMP form then runs unprivileged.
Flags that change what the trace shows
A handful of flags cover nearly every troubleshooting job, and the defaults explain why a first trace looks the way it does.
| Flag | What it changes | Default | Reach for it when |
|---|---|---|---|
| -m | Hop ceiling | 30 | A trace to an unreachable address never ends |
| -q | Probes per hop | 3 | You want a quicker trace or a better loss estimate |
| -f | First time to live | 1 | The hops you care about start later |
| -w | Seconds to wait per probe | 5.0 | One silent hop is stretching the whole run |
| -n | Name resolution | off | A slow resolver is what makes the trace feel slow |
| -N | Simultaneous probes | 16 | ICMP rate limiting is dropping replies |
| -p | Destination port | 80 for TCP | The TCP method needs the served port |
| -4 / -6 | Address family | IPv4 when both exist | You need to prove which stack fails |
| –mtu | Reports path MTU as it goes | off | You suspect a fragmentation problem |
| packet length | Probe size in bytes | 60 for IPv4 | You are testing path MTU behaviour |
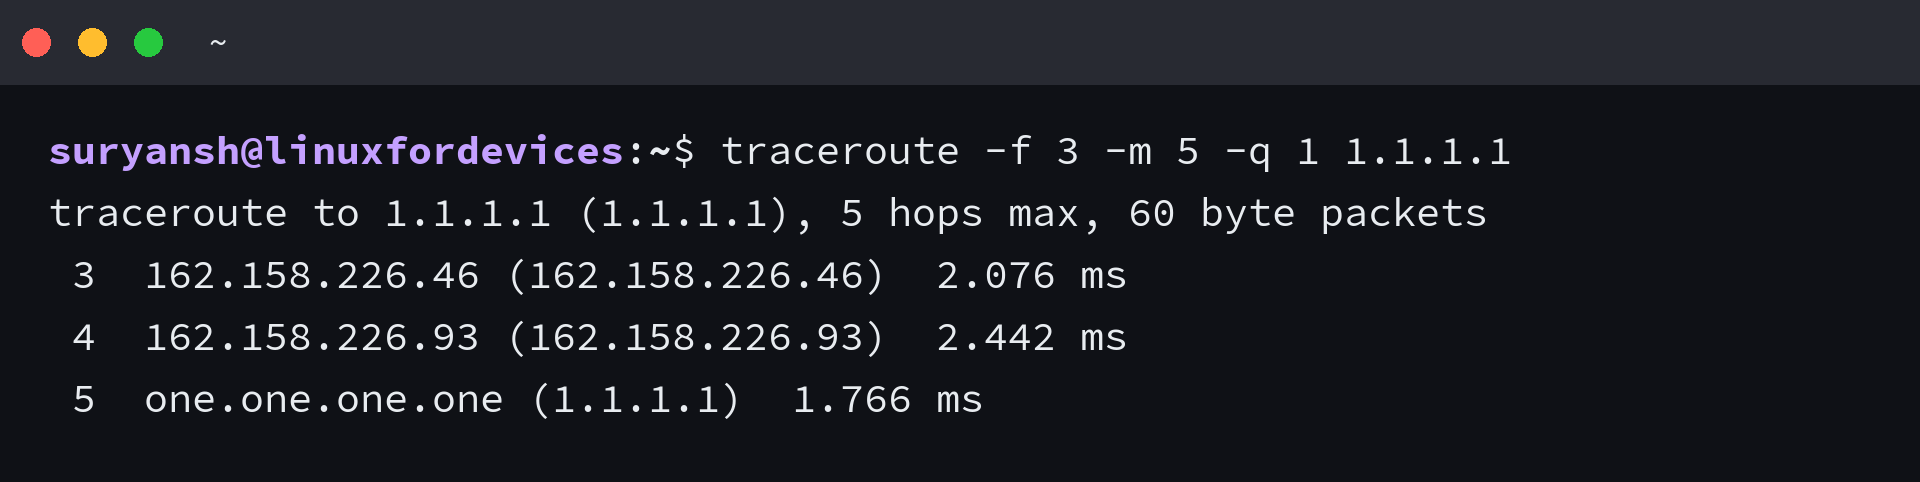
The -f flag is the one readers miss. Starting at a later time to live skips the local hops you already trust and shortens a long trace to the hops that matter.
The probe size carries no letter of its own. It goes after the host name, so traceroute with a host and a number is one command with two arguments rather than a flag in disguise.
I started the same destination at the third hop and the trace opened on that router, which is the cleanest way to confirm the flag did what you meant. Forcing the address family is the other useful trick, and wget takes the same -4 and -6 flags when you want to test one stack against a known-good client.
Address family is the other flag pair worth knowing before you debug an IPv6 problem. A name with both an A and an AAAA record goes down the IPv4 path by default, so a broken IPv6 route stays invisible until you pass -6 and watch the trace die at the first hop outside your network.
Trace a path without root
tracepath ships with iputils on Debian and Ubuntu, sends unprivileged UDP probes, and never asks for a password. It reports one thing traceroute leaves out.
Every line carries the path MTU, the largest packet that still fits to that hop, plus a note when the return path differs from the outbound one.
I ran tracepath against the same address and it ended with Too many hops and a resume suggestion, which is how it reports reaching the ceiling rather than the destination.
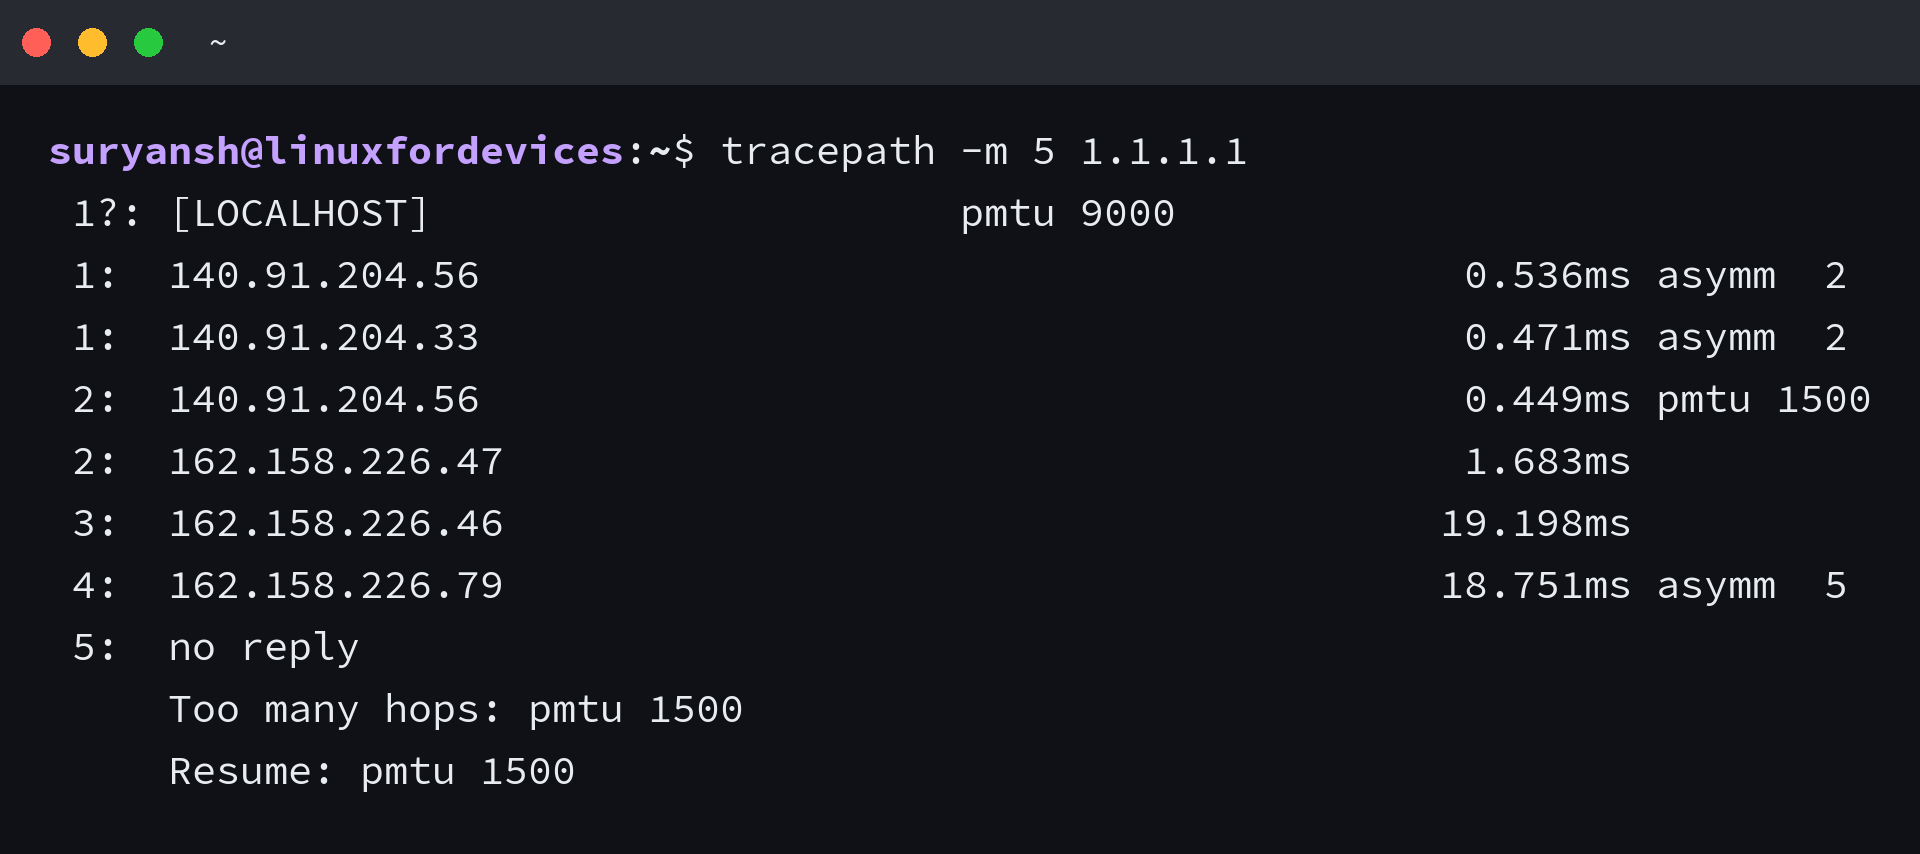
That convenience costs the method choice. tracepath cannot send ICMP or TCP probes, so a path that ignores UDP stays silent for it as well.
mtr is the other tool worth knowing. It repeats the trace and reports loss per hop, which settles the question a single trace cannot answer. The mtr-tiny package is small enough for a rescue image or a router.
Its Loss column is the one to read. Loss that appears at a middle hop and disappears at the destination means that router is limiting how often it answers, while loss that runs all the way to the last hop is the fault you were looking for.
If the confusion is the address rather than the path, the interface and its addressing come before any trace will make sense.
When the output stops making sense
Hop lines can end in text that reads like a crash report, and one symbol in the time columns looks like packet loss. Both are ordinary on a live network and both have a mechanical cause.
The first is annotation text at the end of a hop line. The manual lists the codes a Linux build can print, and every one of them describes an ICMP error rather than a traceroute fault.
- !H – the host is unreachable
- !N – the network is unreachable
- !P – the protocol is unreachable
- !X – communication is administratively prohibited, which is a firewall refusal
- !S – the source route failed
- !F – fragmentation is needed and the packet carried the no-fragment flag
- !<num> – a raw ICMP unreachable code the build has no name for
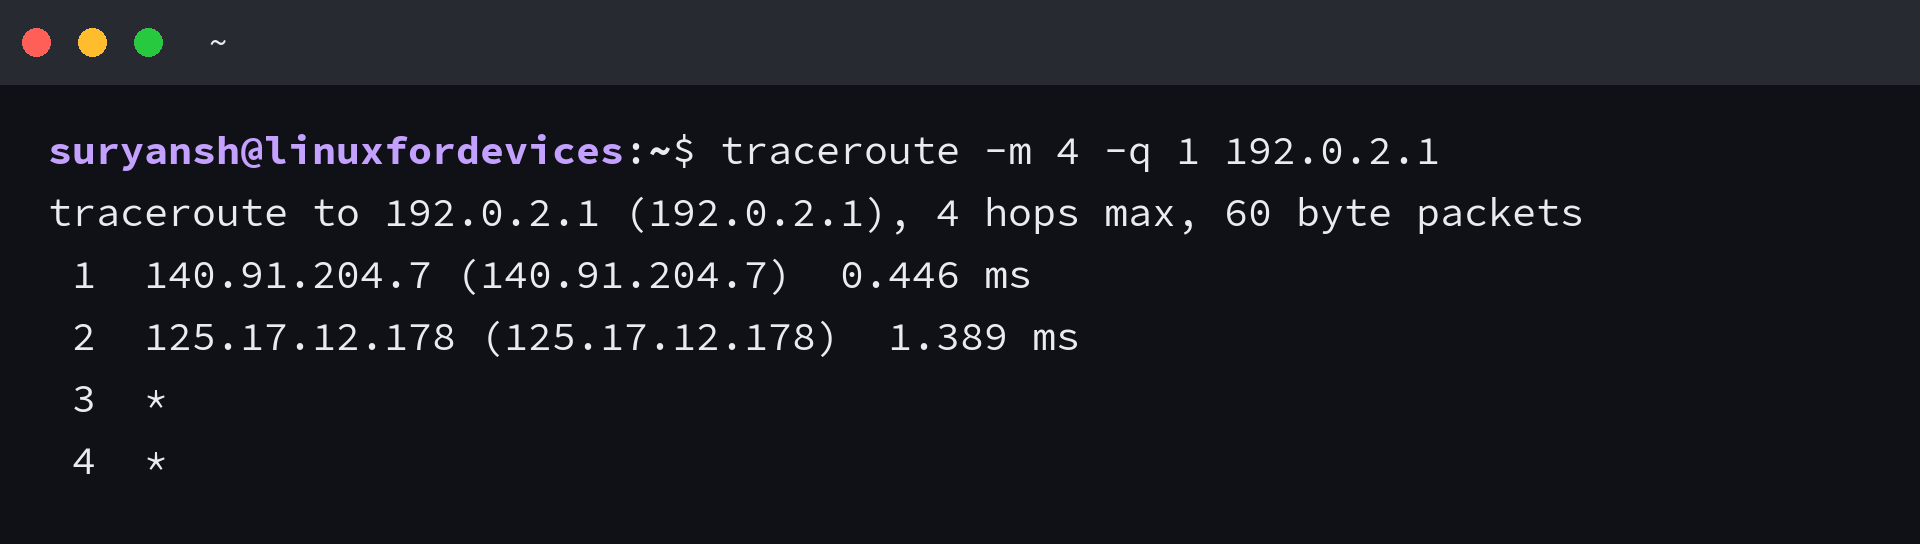
The second is an asterisk. A router that says nothing in one probe and answers the next is throttling its own error replies, and a run of asterisks usually means a firewall configured to ignore probes.
A trace that never reaches the destination still exits cleanly, so read the last hop rather than the exit code.
A name that does not resolve fails before any probe leaves, which is a different failure with a different fix. Querying the name with dig separates a resolver problem from a routing one.

When a hop stays silent and you need the packet itself, capturing it with tcpdump shows whether the probe left and whether a reply came back. A refusal code such as !X points at a filter, and the firewall configuration is where that rule lives.
The next command when a hop looks wrong
A silent hop is a router declining to spend effort on you, and the way to settle it is to repeat the measurement rather than stare harder at the first trace.
Send the same destination again with a method the path is likelier to answer, then compare the hop counts side by side.
There is also a point where the trace is clean and the answer sits elsewhere. A destination that answers your probes but refuses the service port has a firewall rule on the far end rather than a routing fault.
tracepath -m 20 1.1.1.1
sudo traceroute -T -p 443 -m 20 1.1.1.1
mtr -r -c 20 1.1.1.1
When the hop count matches across all three and only the times move, the path is carrying your traffic and the application is the place to look next. Listing the listening sockets with ss answers whether anything on the far end is waiting for the connection at all.
Frequently asked questions about traceroute
Does traceroute need root on Linux?
Not for the default UDP method. The ICMP form with -I and the TCP form with -T build sockets the kernel reserves, so they return a privilege error unless net.ipv4.ping_group_range allows your group or you run them with sudo.
Why does traceroute show only asterisks?
A router answered nothing inside the wait window, usually because it rate limits ICMP replies or a firewall drops probes to an unlikely UDP port. Repeat the trace with the ICMP or TCP method before you treat the silence as an outage.
What is the difference between traceroute and tracepath?
tracepath runs without root, probes with ordinary UDP sockets, and prints path MTU and asymmetry. traceroute can choose between UDP, ICMP and TCP probes, which is what you need when a filtered path ignores one of them.
Is traceroute the same as tracert?
They measure the same thing by different means. Windows tracert sends ICMP echo probes, while the Linux default sends UDP datagrams to an unlikely port, so the two can disagree about which hops answer.
Why can a later hop show a lower time than an earlier one?
The times measure the reply from each router, and a busy router deprioritises the error it owes you. Consistent times across hops matter more than any single value.