In this article, we will learn some beginner-friendly and very basic GDB Debugger commands. We’ll learn how to compile a program so that it can be passed to GDB for debugging.
Also read: Building And Executing C/C++ Programs Using Terminal
Quick Summary
We will learn how to start a C/C++ program under debugging mode. We’ll go through some most commonly used GDB commands like: break, step, next, run, and a few more commands which a no less than a swiss army knife for a programmer and particularly a debugger. So without any further talk let’s dive straight into GDB Debugging Basics.
Debugging With GDB
Debugging is a must-have programming skill. Every programmer needs to debug some application, be it for some organizational or personal purpose. It is a very well-known fact that most of the time of a programmer is spent debugging the previously written code. Hence, one should always learn some debugging so that he/she can bring himself/herself out of some erroneous trouble easily without wasting any time.
Why GDB?
Most of the big tech companies use just the command line and bash shell for debugging and writing code. Also, using GDB inculcates some very conceptual concepts to the user. GDB is a command-line tool that makes us visualize what’s going inside the code while the program is running. One gets to learn and enhance some very basic and most crucial concepts like memory allocation, working with pointers, memory addresses, and most importantly imagining what’s happening on the inside of the program that is being run in by the user.
Some Basic GDB Commands
- break: This command is used to add a breakpoint to some specific location inside the program, be it a line or a function call.
- next: This command takes you to the next line in the program. Suppose you hit the breakpoint set at line number 7, then using “next” or “n” will take you to line number 8.
- step: This command takes you into some function or into the block of the code that is currently being executed
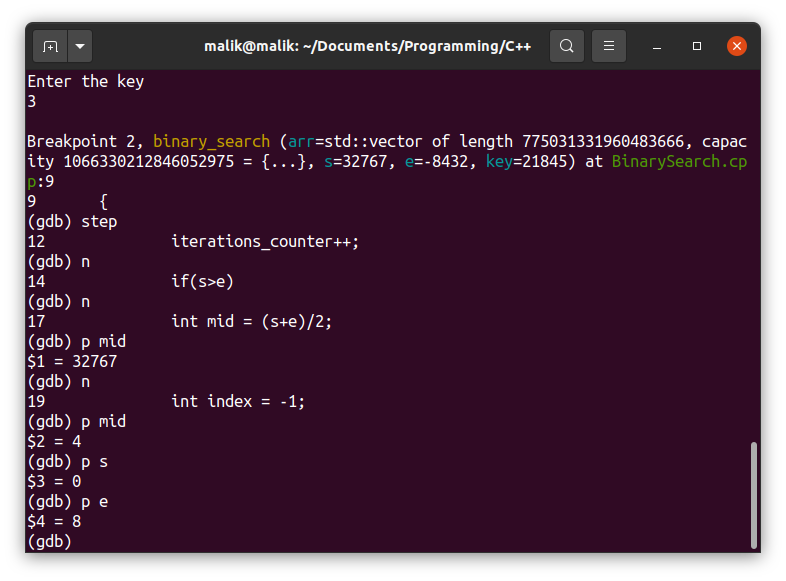
- print: It is used to display the value of different variables or function calls. You can simply type in “p”
- run: Whenever we start debugging, we need to run the program, for that purpose, the “run” command is there
- continue: This command takes us to the next breakpoint.
Debugging a C++ Program with GDB
Okay, let’s now try to see what’s going on inside this “Binary Search” C++ program.
Code for a simple Binary Search Program
#include <iostream>

#include <vector>

using namespace std;

int iterations_counter = 0;

int binary_search(vector < int > arr, int s, int e, int key) {
  //base case

  iterations_counter++;

  if (s > e)
    return -1;

  int mid = (s + e) / 2;

  int index = -1;

  if (arr[mid] == key)
    index = mid;
  else if (arr[mid] > key)

    index = binary_search(arr, s, mid - 1, key);
  else
    index = binary_search(arr, mid + 1, e, key);

  return index;
}

int main() {
  cout << "Enter the elements of the vector(Press -1 to stop)" << endl;
  vector < int > arr;

  while (true) {
    int n;
    cin >> n;

    if (n == -1)
      break;
    arr.push_back(n);
  }

  cout << "Enter the key" << endl;
  int key;
  cin >> key;

  cout << "Index at which the key is found(0 based indexing, -1 indicates that the key is not present in the vector): " << binary_search(arr, 0, arr.size() - 1, key) << endl;
  cout << "Total Number of iterations required: " << iterations_counter << endl;
}
How to compile a program to use with GDB
You can enable debugging by enabling the “-g” flag while compiling, as shown in the command below
g++ "your_file_name" -o "your_output_file_name" -g
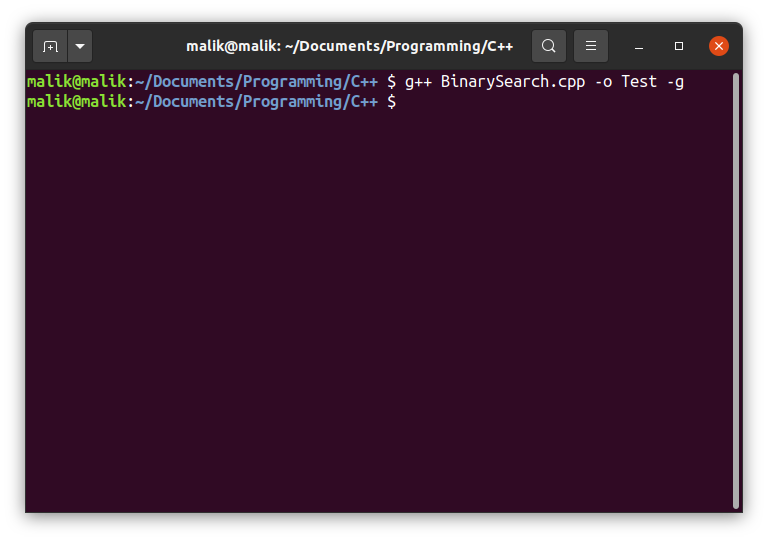
Let’s start debugging by issuing the following command
gdb "your_output_file_name"
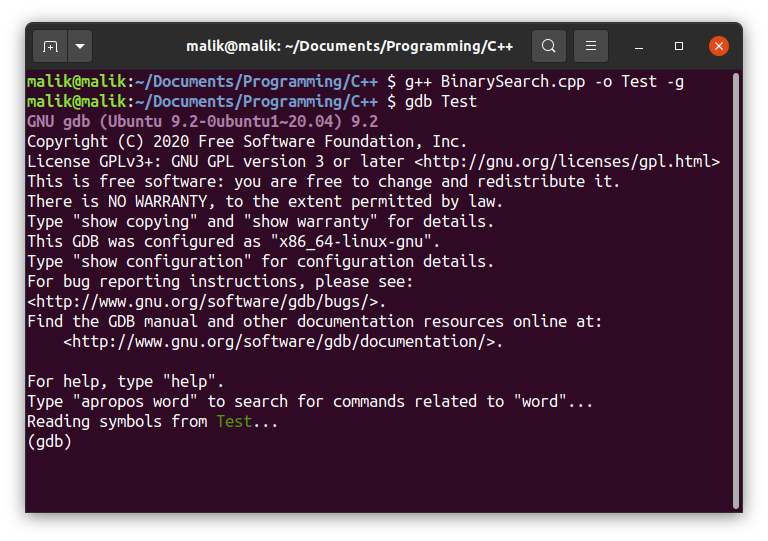
Let’s put a breakpoint on the main, and our binary_search function and then run the program
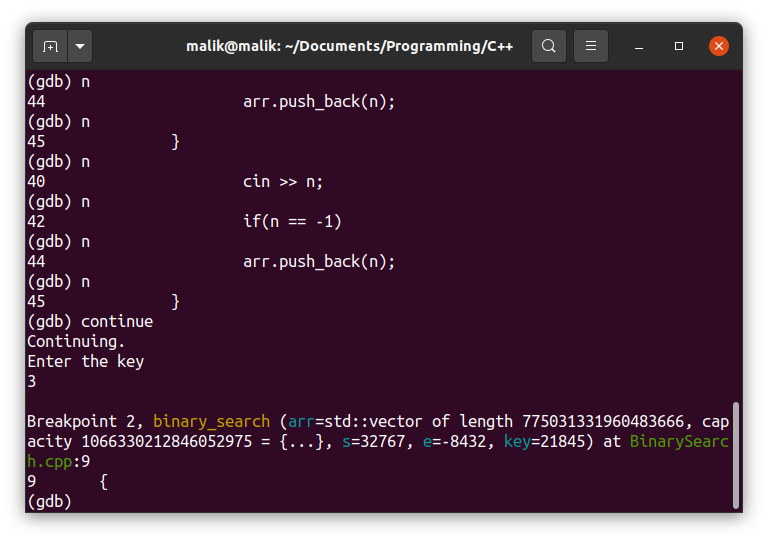
We’ll also use the step and next (n) commands to learn about which line is currently being executed and which block is under execution
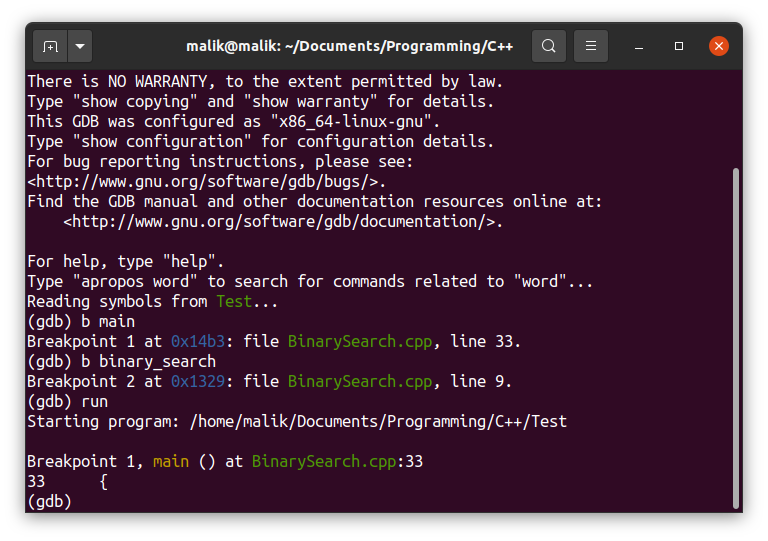
Using the continue command
Using the print (p) command to display the information about various variables.
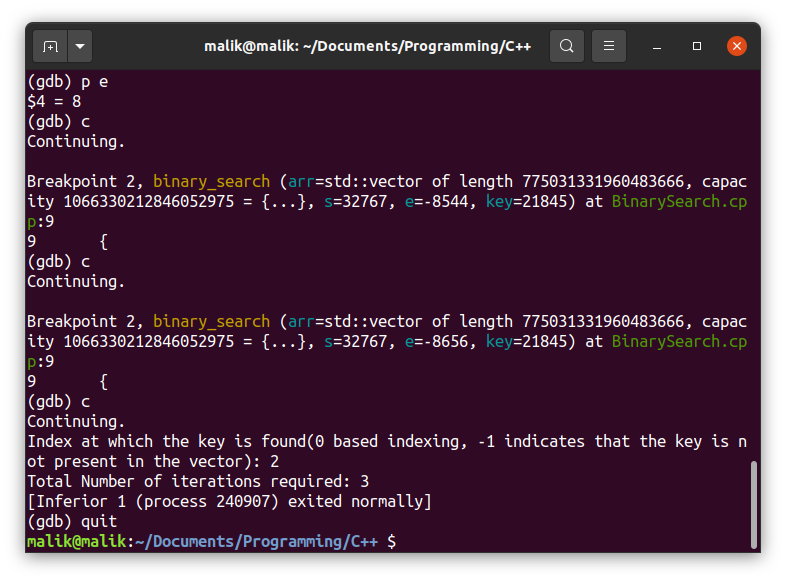
Now, we’ll stop the debugging session using quit.
Conclusion
In this article, we learned how to compile a program for debugging with GDB Debugger, and some of the most fundamental commands and methods of debugging. We learned how to use the run, break, step, next, continue and, print commands.
