In this tutorial, we’ll learn how to use the Linux top command. Managing system resources is essential for a Linux system admin. You need to have control over processor tasks to use your hardware optimally. The Linux top command shows you the running processes on your system. It also helps you monitor how the system resources are engaged. This tutorial is to help you understand this command and use it effectively.
Understanding the top Command in Linux
While there are many variants of Linux top command, this tutorial uses the most common one – found in the ‘procps-ng’ package. To check if you are using the same version, input the following command.
top -v
Expected output:
procps-ng 3.3.12
Usage:
  top -hv | -bcHiOSs -d secs -n max -u|U user -p pid(s) -o field -w [cols]
Understanding the interface of Linux top command
Now type this your command line to launch the top interface.
top
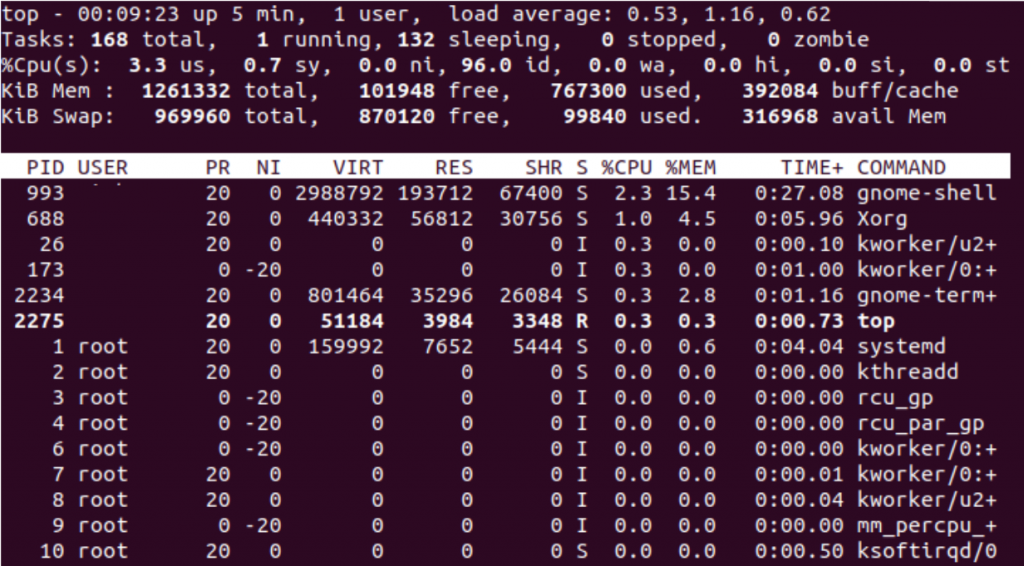
Here’s the default expected output:

The upper portion shows us the current usage statistics of your system resources. Below it, we see the list of the running processes. You can navigate the interface using the up/down arrow keys and press q to quit.
The Linux Top Command Summary – The Upper Region

The first line shows you the system time, the up-time, and the number of active users. After these, you get the load average. This has three values: average ‘load’ on the system over a minute, five minutes and 15 minutes going left to right respectively.
The second line is known as the task section. It shows the total number of tasks along with the number of tasks in different ‘states’. Any process can have the following states:

- Runnable (R): Process being executed / ready to be executed
- Sleeping-Interruptible (S): Process waiting for an event to finish
- Sleeping-Uninterruptible (D): Process waiting for an I/O operation
- Stopped (T): Process has been stopped
- Zombie (Z): Process has been terminated, data structures retained

The third line shows us the percentage of CPU usage. Let’s discuss the values that are being stated here:
- us – value is time spent on userspace tasks
- sy – value is time spent on kernel space tasks
- id – value is time spent being idle
- wa – value is the time spent on waiting for I/O tasks to finish.
The “ni” value or the nice value is used to determine how nice a task is to other processes. What do I mean by that? A task that’s nicer to other tasks will have lower priority and will use lesser CPU resources.

Finally, the last two lines show memory usage. Here ‘Mem’ shows RAM information and ‘Swap’ shows the swap space information. Swap space is a portion of the hard disk where some data from the RAM is temporarily written. This is used when RAM is almost full.
The ‘avail Mem’ is the amount of memory available for allocating processes, without further swapping. The total memory used by disk buffers and disk cache is given by ‘buff/cache’.
Tasks List – Linux Top Command
Let’s have a look at the tasks list and explore it in detail. There are a few columns that you can see which display specific information about each process. We’ll go over each column in detail.

Here we can see the following details of all running processes:
- PID: The unique ID for a given process
- USER: The user who initiated a process
- PR: The priority of a process in scheduling
- NI: The “nice” value of a process
- VIRT: Total amount of memory used up by a process.
- RES: Amount of memory used by the process in RAM
- SHR: Amount of memory shared by the process with other processes
- S: State of the process (Sleeping, Idle, etc)
- %CPU: Percentage of CPU usage of the process
- %MEM: Percentage of RAM usage of the process
- TIME+: Total amount of CPU time consumed by the process
- COMMAND: This column displays the name of the process
Navigating the Linux top Command Interface
Now that you know what the data being displayed means, let’s understand how we can navigate in and around the top command interface.
Sort The top Command Output
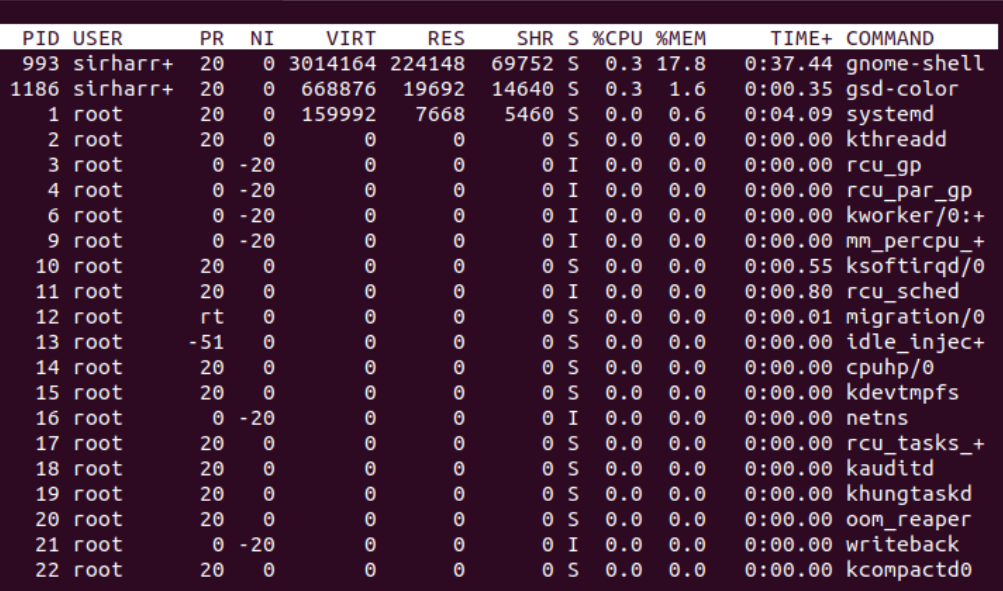
The default view of the top displays the list of processes sorted by the Process ID. However, more often than not you will utilize top to find the processes which are using your system resources the most. In this case, you will utilize these Linux top command to sort the process list.
- Press ‘T’ to sort your list by the runtime
- Press ‘P’ to sort your list by the CPU usage
- Press ‘M’ to sort your list by the amount of memory used
- Press ‘N’ to sort your list by the PID
The default view of your sorted list will be in descending order. If you wish to view the list in ascending order, press ‘R’.
Kill a Process within the Linux top command
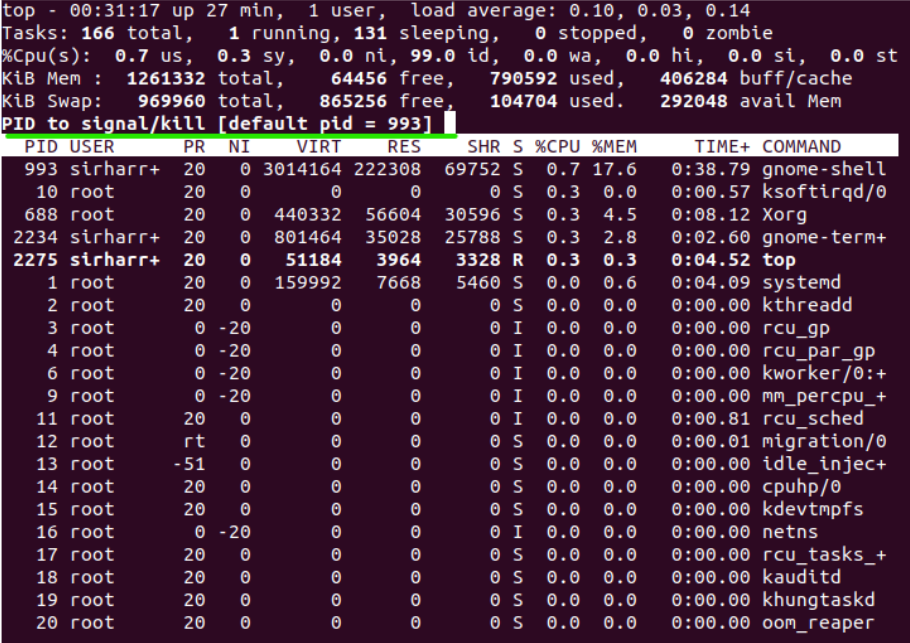
When you want to kill a process using Linux top command, press ‘k’ when the top interface is open. You will get a prompt just above the list of processes asking you the PID of the process you wish to kill. The default input kills the first process.

Once you have entered that, you will be prompted for the kill signal. By default, Linux top command will use SIGTERM to gracefully end a process. Typing SIGKILL will end the process forcefully. Alternatively, you can use signal number 9 for SIGKILL and 15 for SIGTERM.
Display the Running Threads
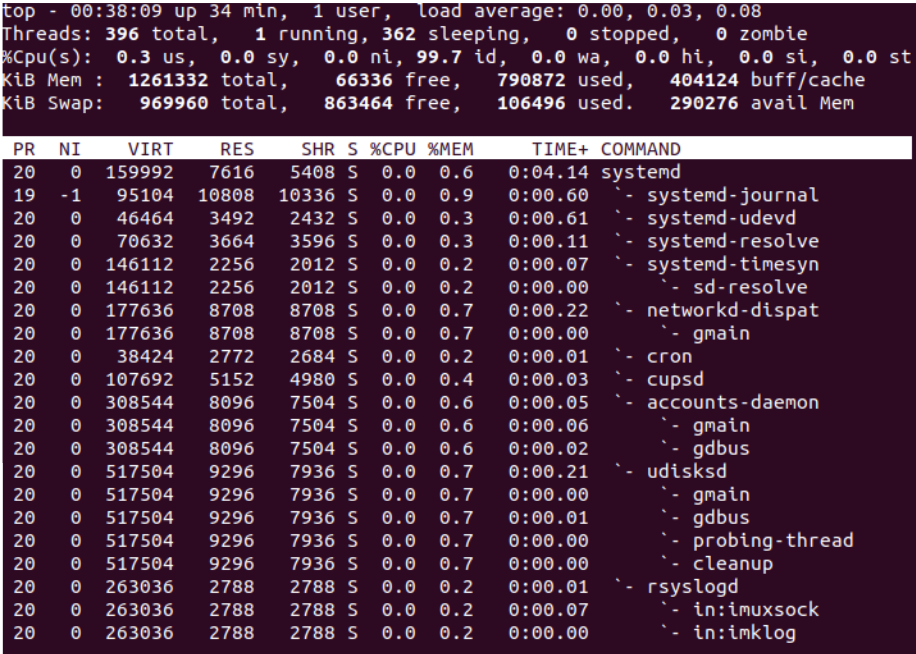
The default view of the Linux top command displays the number of running tasks with the list of processes. When you want to view running threads instead of tasks using top, press ‘H’ when the Linux top command interface is open.
You can notice that in place of tasks, you can now see the number of running threads. However, the processes list remains unaffected. This is because the same data structures deal with both the threads and processes. This gives each thread its own ID and other attributes.
Filter Processes Based on Multiple Conditions
When you are dealing with a large number of processes, you need to filter out the ones you don’t want to deal with. To filter the processes using Linux top command, press ‘O’. This brings up a prompt which asks you the type of filter you wish to use. Some common example of filter expressions are:
- USER=root: Shows all processes where the USER attribute reads “root”
- !USER=root: Shows all processes where the USER attribute doesn’t read “root”
- %MEM>2.0: Shows all processes which are utilizing at least 2% of CPU capacity
You can add multiple overlapping filters to narrow down your list of processes. Pressing ‘=’ would remove all applied filters from the list.
Enable Forest View
It is also important to know the hierarchy of the running processes. When you want to view this using top, press ‘V’ when the Linux top command interface is open.

This will give you the list of processes in forest view and make it easier to determine which processes are associated with each other.
Save Your Configuration
When you use Linux top command for the first time, there would be some changes you made to customize top to your tastes. However, every time you open the Linux top command, it opens in the default format. Well, the good part is that you can save your custom configuration by pressing ‘W’ before closing the top interface.
Get the List of All the Available Commands
With so many commands available at your disposal, it’s easy for a beginner or sometimes even long time Linux top command users to forget one while working. When you find yourself in such a fix, just press ‘h’ and you will find a list of all commands right in front of you.
Conclusion
The Linux top command is essential to manage system resources and monitor processes easily. While this article taught you some of the most basic top commands, there are many others that make the Linux top command a powerful tool. We hope you were able to get familiar with using the Linux top command. If you have any doubts or queries, drop them down in the comments below.


